%2Fsportzpoint%2Fpost_banners%2F5c6767f5260be99d6abb4cb89e2bafea4be2c1f71c56b1616e9680d55f57824a.jpg&w=3840&q=75)
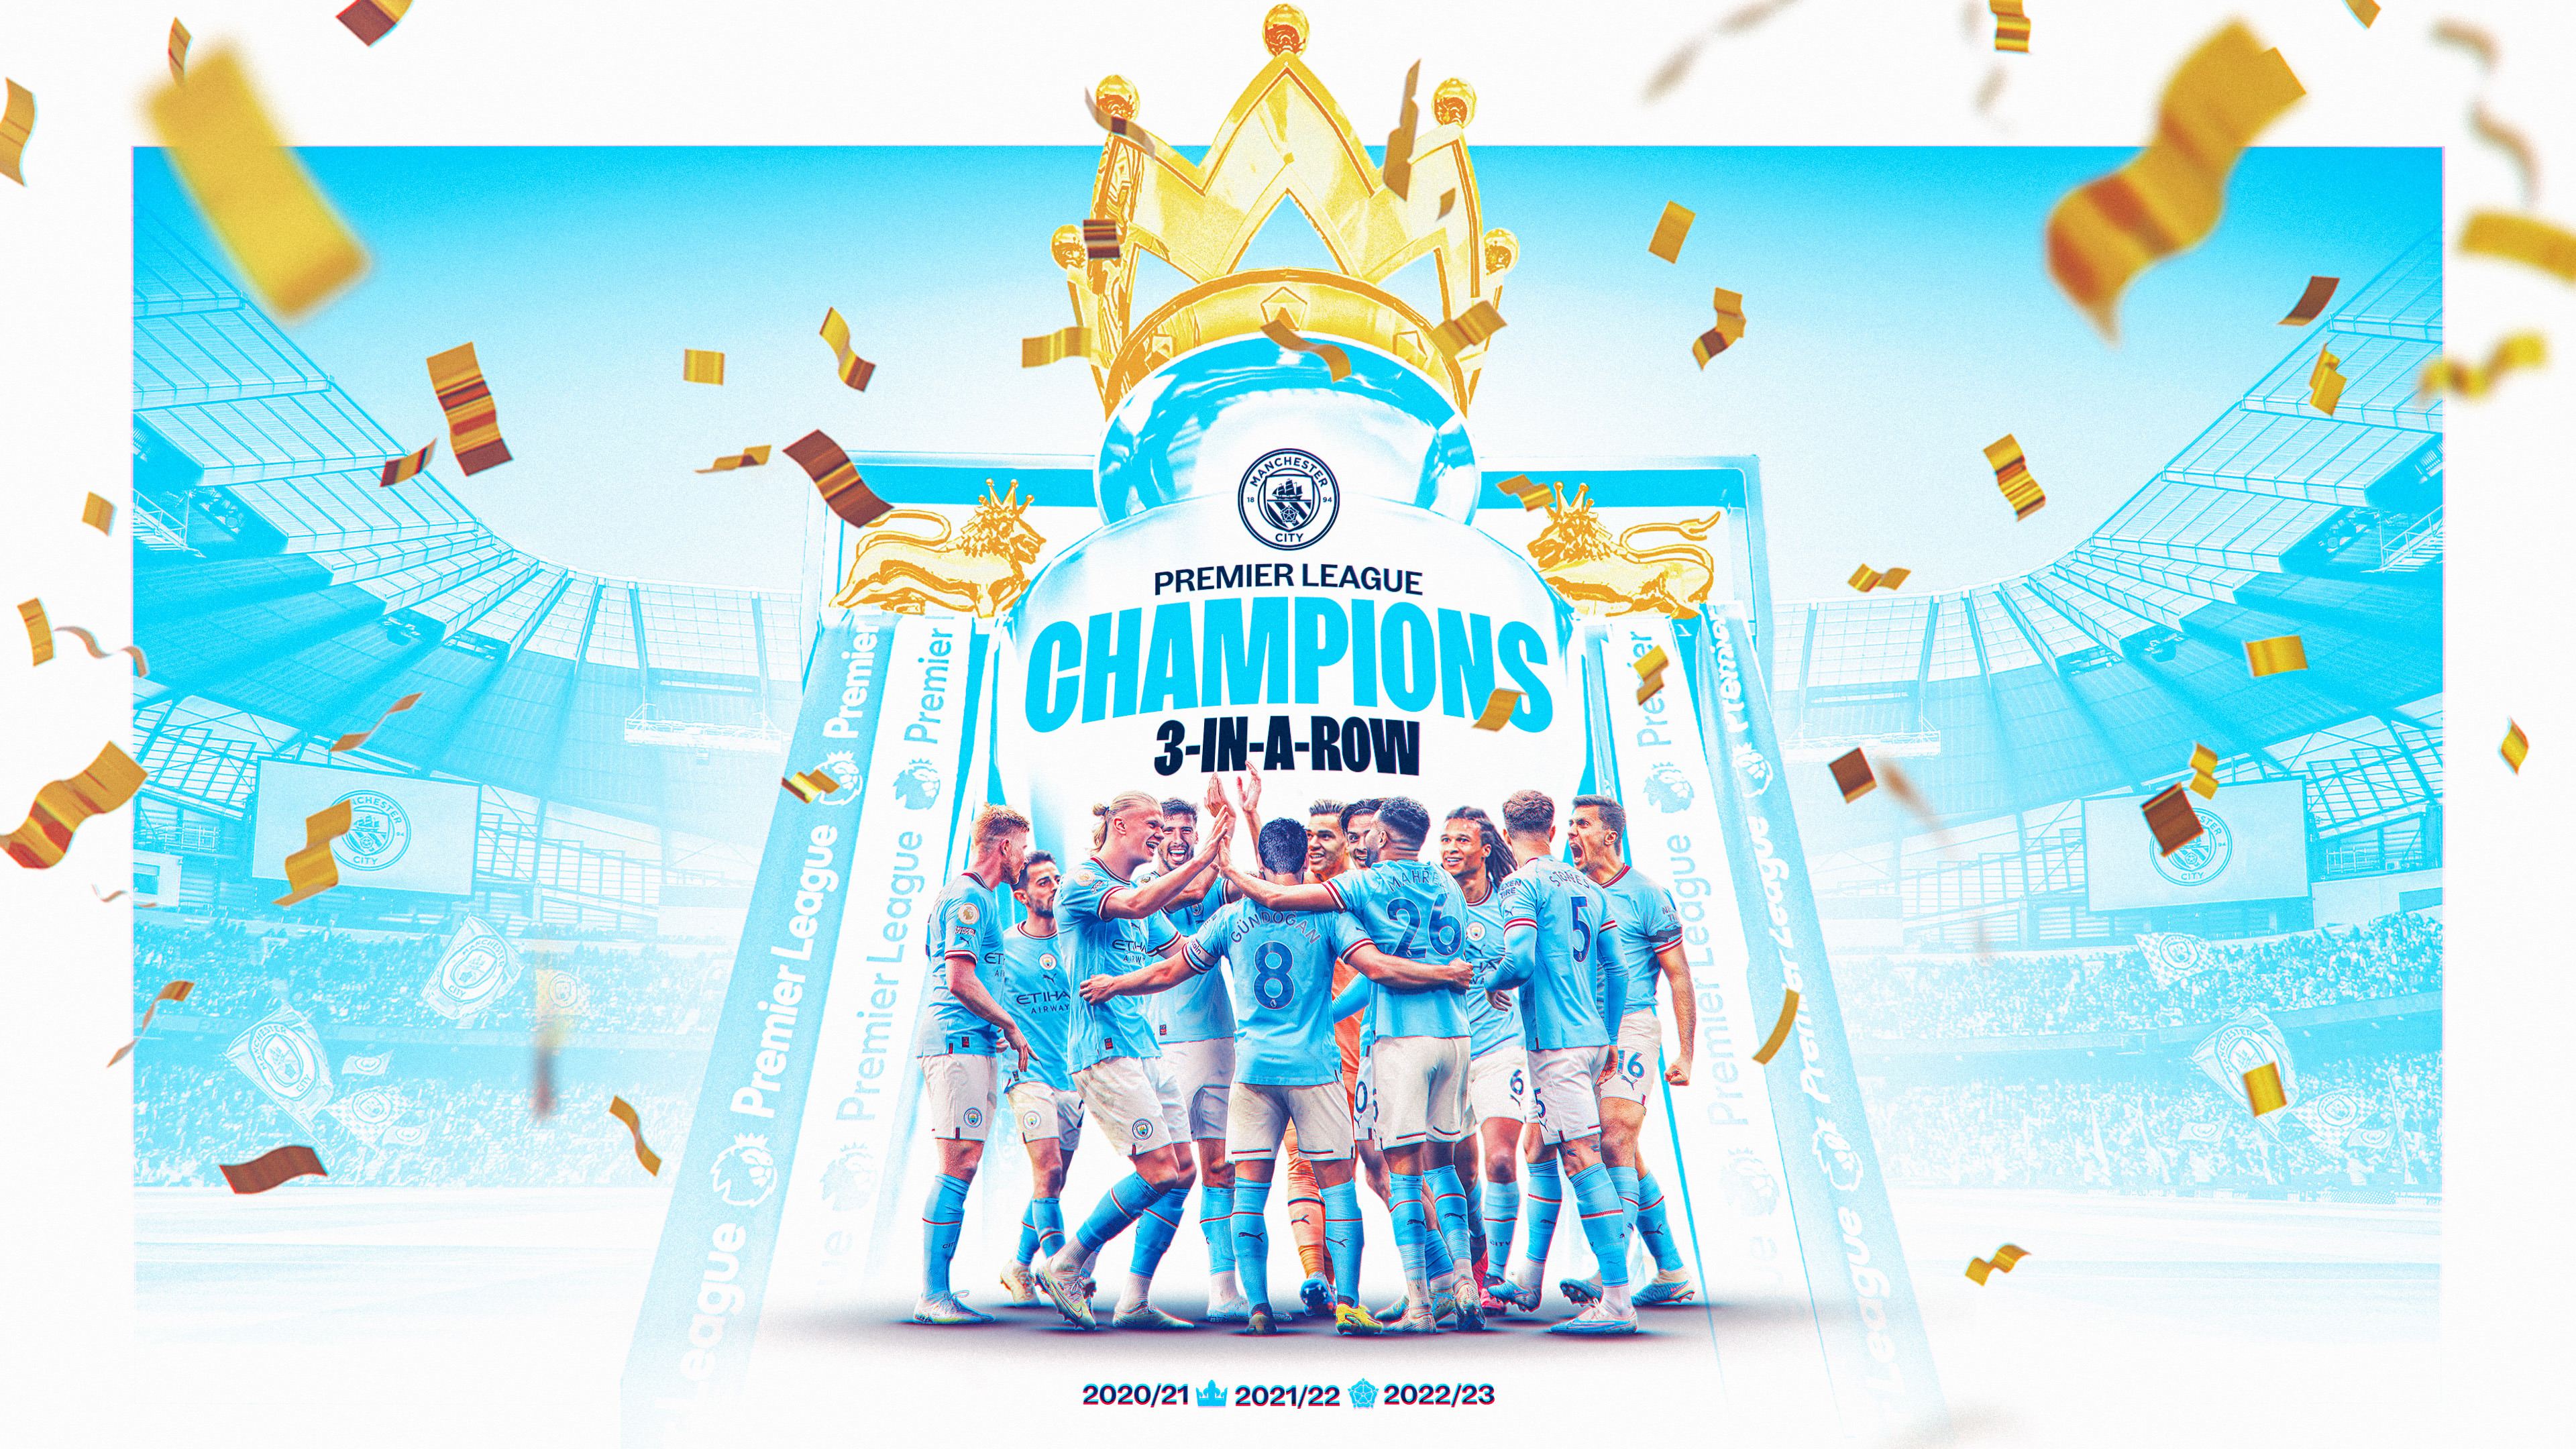
Manchester City overtook Arsenal to win their third successive league title, while Manchester United and Newcastle sealed their return to the Champions League. But if you look at the underlying stats, then the Premier League xG table tells a complete different story.
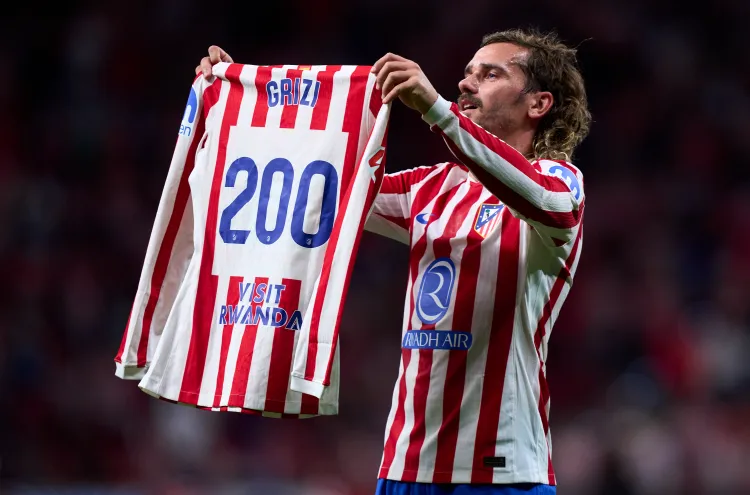
Meanwhile, sides like Chelsea and Liverpool have had their struggles this season in terms of results, but what about the underlying performances?
/sportzpoint/media/post_attachments/79e49f2a6befd900442f656d47bc6dd1cf1cf936b91a70af8efa2c7bfd00555e.jpg)
The Expected Goals (xG) metric uses a complex algorithm to determine the quality of chances that each side has created and conceded this season, giving us a useful tool to measure how good their performances have actually been, regardless of the scorelines.
With data from Understat, here are the Premier League xG table in terms of Expected Goals so far this season.
Expected Goals (xG)
1. Manchester City – 84.32
2. Liverpool – 80.77
3. Brighton – 77.72
4. Newcastle United – 76.98
5. Arsenal – 76.51
6. Manchester United – 71.90
7. Brentford – 59.23
8. Tottenham – 57.83
9. Chelsea – 51.89
10. West Ham United – 51.21
11. Aston Villa – 50.00
12. Leicester City – 48.99
13. Everton – 48.65
14. Fulham – 47.98
15. Leeds United – 47.80
16. Crystal Palace – 40.72
27. Bournemouth – 40.08
18. Nottingham Forest – 39.57
19. Southampton – 39.27
20. Wolves – 35.13
Expected Goals Against (xGA)
1. Manchester City – 34.21
2. Newcastle United – 41.86
3. Arsenal – 45.16
4. Brighton – 50.15
5. Manchester United – 50.29
6. Brentford – 51.45
7. Crystal Palace – 51.63
8. Tottenham – 51.66
9. Aston Villa – 53.96
10. Chelsea – 54.02
11. West Ham United – 55.31
12. Liverpool – 55.77
13. Leicester City – 59.79
14. Wolves – 62.68
15. Southampton – 62.90
16. Bournemouth – 67.60
17. Nottingham Forest – 68.46
18. Everton – 68.58
19. Leeds United – 69.58
20. Fulham – 71.49
Expected Points (xPTS)
1. Manchester City – 83.04
2. Arsenal – 72.53
3. Newcastle United – 71.67
4. Brighton – 70.86
5. Liverpool – 67.37
6. Manchester United – 66.40
7. Brentford – 58.26
8. Tottenham – 57.60
9. Aston Villa – 54.37
10. Chelsea – 52.28
11. West Ham United – 51.62
12. Leicester City – 45.07
13. Crystal Palace – 44.24
14. Everton – 40.71
15. Leeds United – 40.58
16. Fulham – 39.24
17. Southampton – 36.47
18. Nottingham Forest – 35.05
119. Wolves – 35.01
20. Bournemouth – 34.73
![East Bengal FC Trophies List [Men's & Women's] | Updated](/_next/image?url=https%3A%2F%2Fpub-fc6b0668ad0242ec8180d92255407043.r2.dev%2Fsportzpoint%2F1779385369364-east-bengal-trophies-list.jpg&w=3840&q=75)
![East Bengal vs Mohun Bagan: Head to Head Stats [UPDATED]](/_next/image?url=https%3A%2F%2Fpub-fc6b0668ad0242ec8180d92255407043.r2.dev%2Fsportzpoint%2F1779083597619-east-bengal-vs-mohun-bagan.jpg&w=3840&q=75)


